Félix Boittin

Lettering filled with a datamosh, drawn live in the browser.

I’m a web analytics and CRO consultant in Paris. For five years I’ve helped teams at Louis Vuitton, Van Cleef & Arpels and Intermarché see where their visitors get stuck, and what to do about it. In my spare time, I build my own software.

Now
Senior analytics & conversion consultant, Converteo
Clients
Louis Vuitton, Van Cleef & Arpels, Intermarché
Tools
GA4, Contentsquare, Tag Manager, Looker Studio, Piano
Building
Clivio, Hermes and Prisme

Work

Most of this was through Converteo. Click a line to read more, or hover it for a preview.

5+ years, 5 missions, 3 of them in detail below.

Show
  • I was the Contentsquare lead for the maison worldwide. I trained teams at headquarters and in the international markets so they could read the data themselves, and I ran UX and behavioural analyses on e-commerce and product projects, cross-checked with web analytics.

    Converteo. Contentsquare, web analytics

    Read the full case

The full version is on LinkedIn.

In detail

Three of those missions in more detail. The drawings show how I work, not the clients’ data.

Louis Vuitton

Role
Global Contentsquare lead
When
April 2025 to January 2026
Through
Converteo
Tools
Contentsquare, web analytics

Teaching teams around the world to read their own data.

Louis Vuitton uses Contentsquare to see how people behave on its sites: what they look at, what they click, where they hesitate. A tool like that is only useful if the people at headquarters and in each market know how to read it, and what to do next.

What I did

  • I was the go-to Contentsquare person for headquarters and the international teams.
  • I built and ran the training, and shared the ways of analysing that work, so teams could answer their own questions.
  • I looked for friction in the journeys on e-commerce and product projects, and always came back with recommendations.
  • I put Contentsquare and web analytics side by side, to link what people do on a page with where they came from and whether they bought.
ContentsquareWhat people do on the page: scrolls, clicks, hesitation, frustration.
Web analyticsWho they are, where they come from, whether they buy.
Why a journey works, or doesn’t.
Click rate by zone

Zone Add to bag

Exposure rate 84%
Share of page views where the zone was actually seen.
Click rate 44%
Share of page views with a click on the zone.
Attractiveness 52%
Of the visitors who saw it, how many clicked.
Hesitation time 4.6 s
Time between the last hover and the first click.
Conversion per click 17.5%
Of the visits that clicked it, how many converted.
How a zoning analysis reads a product page, with numbers for every zone. Point at a zone to read it. Illustration, not client data.

Van Cleef & Arpels

Role
Senior web analyst
When
February 2024 to May 2025
Through
Converteo
Tools
GA4, Contentsquare, Looker Studio

First, the numbers had to be right.

Van Cleef & Arpels wanted a clear view of how its websites perform and how visitors move through them, with figures the business teams could trust. Before any chart, that meant getting the tracking right.

What I did

  • I analysed journeys and performance in GA4 and Contentsquare, and followed each recommendation until it went live.
  • I got the business teams started on Contentsquare, then helped them structure their UX and CRO analyses.
  • I wrote the tagging plans and tested the tracking, so every event fires when it should and carries the right data.
  • I built the Looker Studio dashboards used to follow the main KPIs day to day.
  1. Tagging planEvery action worth measuring, named once and documented.
  2. Implementation & QAEach event checked in the browser and in GA4 before it counts.
  3. GA4 and ContentsquareCollection, explorations, journey analyses.
  4. Looker StudioKPIs followed day to day by the teams.
Excerpt of a GA4 tagging plan. Illustration, not the maison’s plan.
EventFires whenParameters
view_itemA product page loadsitem_id, item_name, item_category, price
select_itemA product is clicked in a listitem_list_name, index
add_to_wishlistThe wishlist icon is clickeditem_id, item_name
begin_checkoutThe checkout opensvalue, currency, items
book_appointmentA boutique appointment is confirmedboutique, appointment_type
Layout of a daily KPI dashboard. Illustration.

Intermarché

Role
Web & app digital analyst
When
October 2022 to February 2024
Through
Converteo
Tools
GA4, Looker Studio

A website, an app, and a switch to GA4 halfway through.

Intermarché sells groceries online, on its website and in its app. The questions were the same on both. Where do shoppers give up between the first visit and the order? Which features do they really use? Where do they come from?

What I did

  • I analysed the funnels, feature adoption and acquisition, on the website and in the app.
  • I helped move everything from Universal Analytics to GA4, and rebuilt the reports around its events.
  • I built Looker Studio dashboards and tested the tracking.
  • I wrote the weekly and monthly reports, and always ended them on what to fix next.
The GA4 migration
  1. BeforeReports built on Universal Analytics.
  2. TransitionGA4 runs alongside; reports and analyses are rebuilt on its events.
  3. 1 July 2023Universal Analytics stops processing data.
  4. AfterGA4 only. Dashboards and reporting carry on without a gap.
Same funnel, web and appWebApp
Visit
Store chosen
Products in basket
Pick-up slot bookedBiggest gap between web and app. I’d start here.
Order placed
How I lay out a funnel across web and app: same steps, side by side, so the gaps jump out. Illustration, not client data.

Clivio

Founder. Designed and built end to end, since November 2025.

Next.js, Firebase, LLM and RAG pipelines.

The Clivio film, 30 seconds, made in code. Shown without sound.All eighteen films

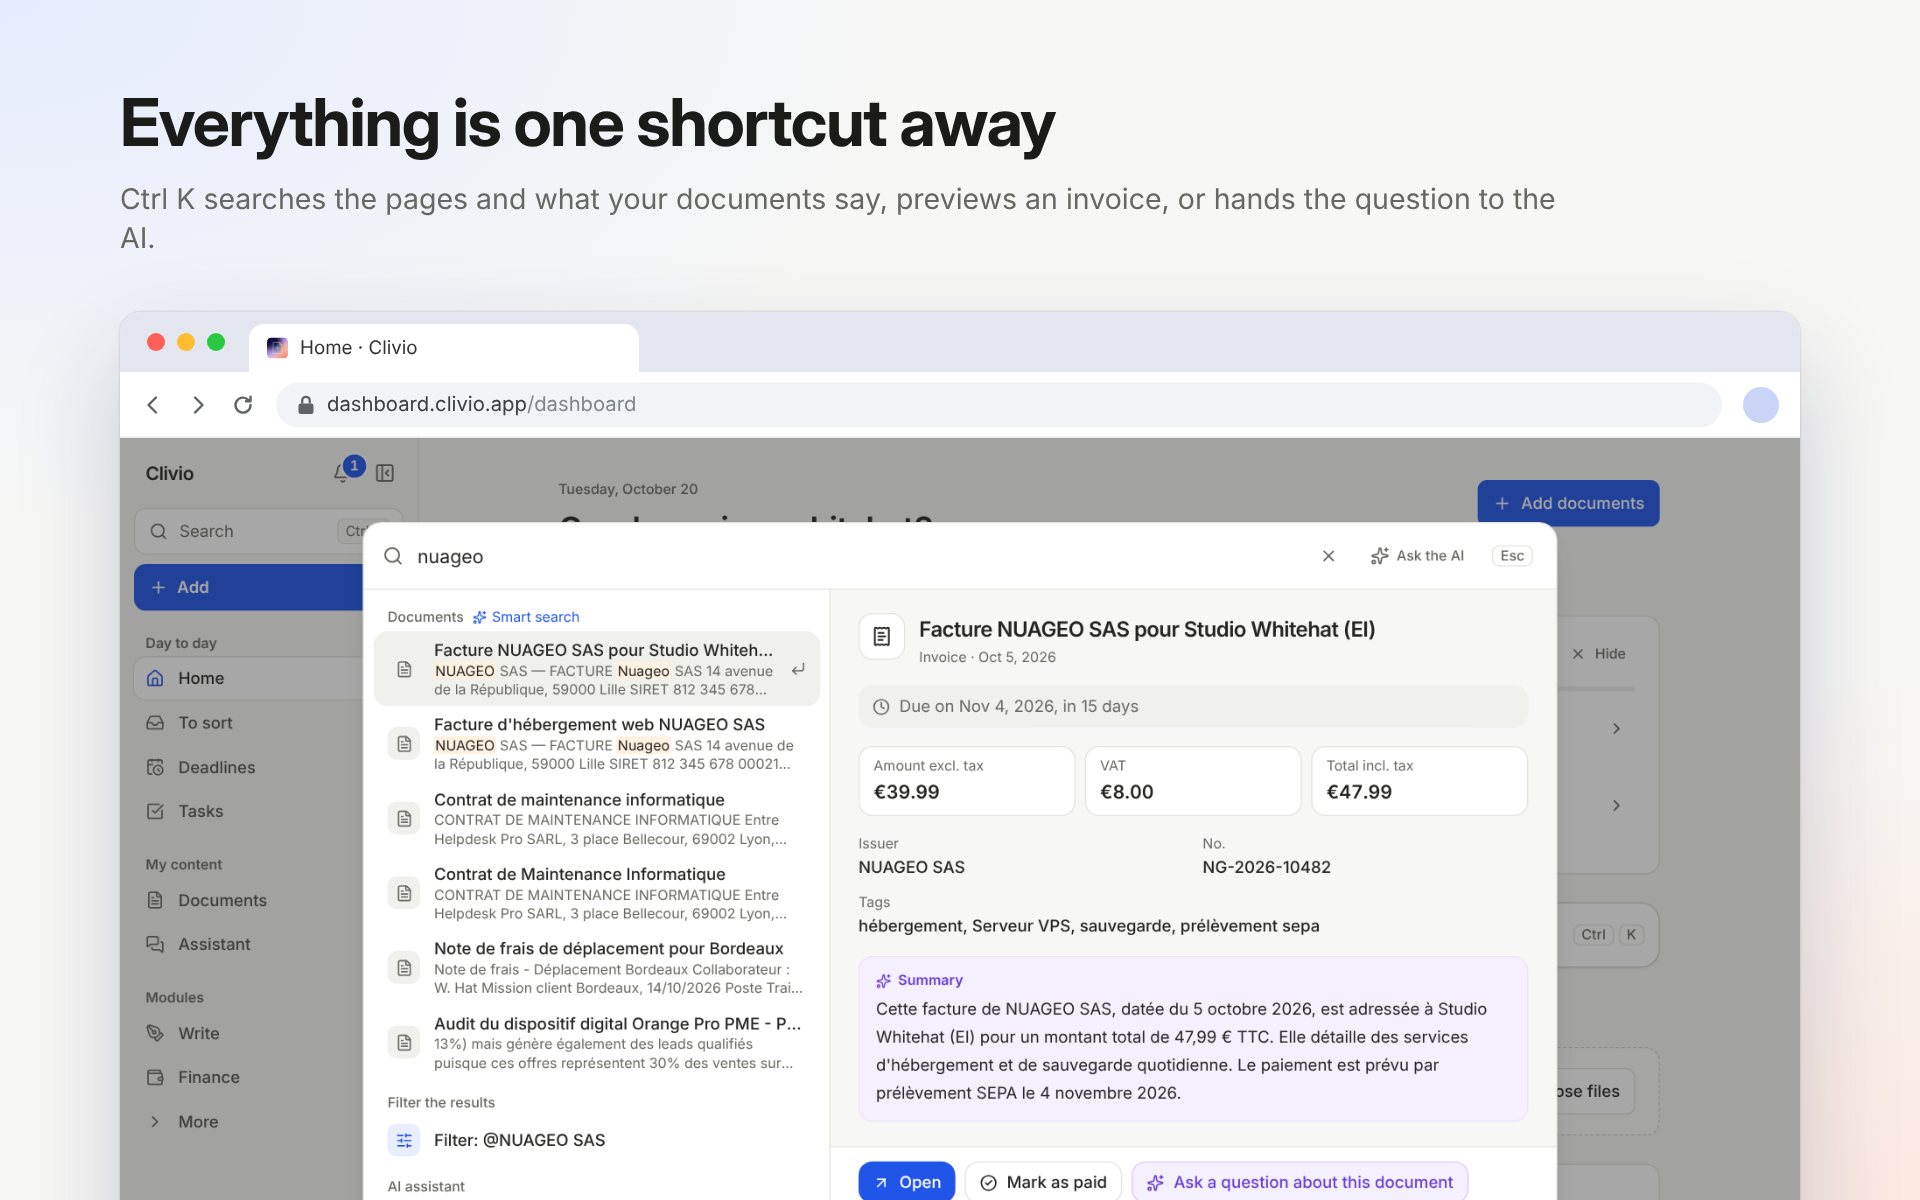
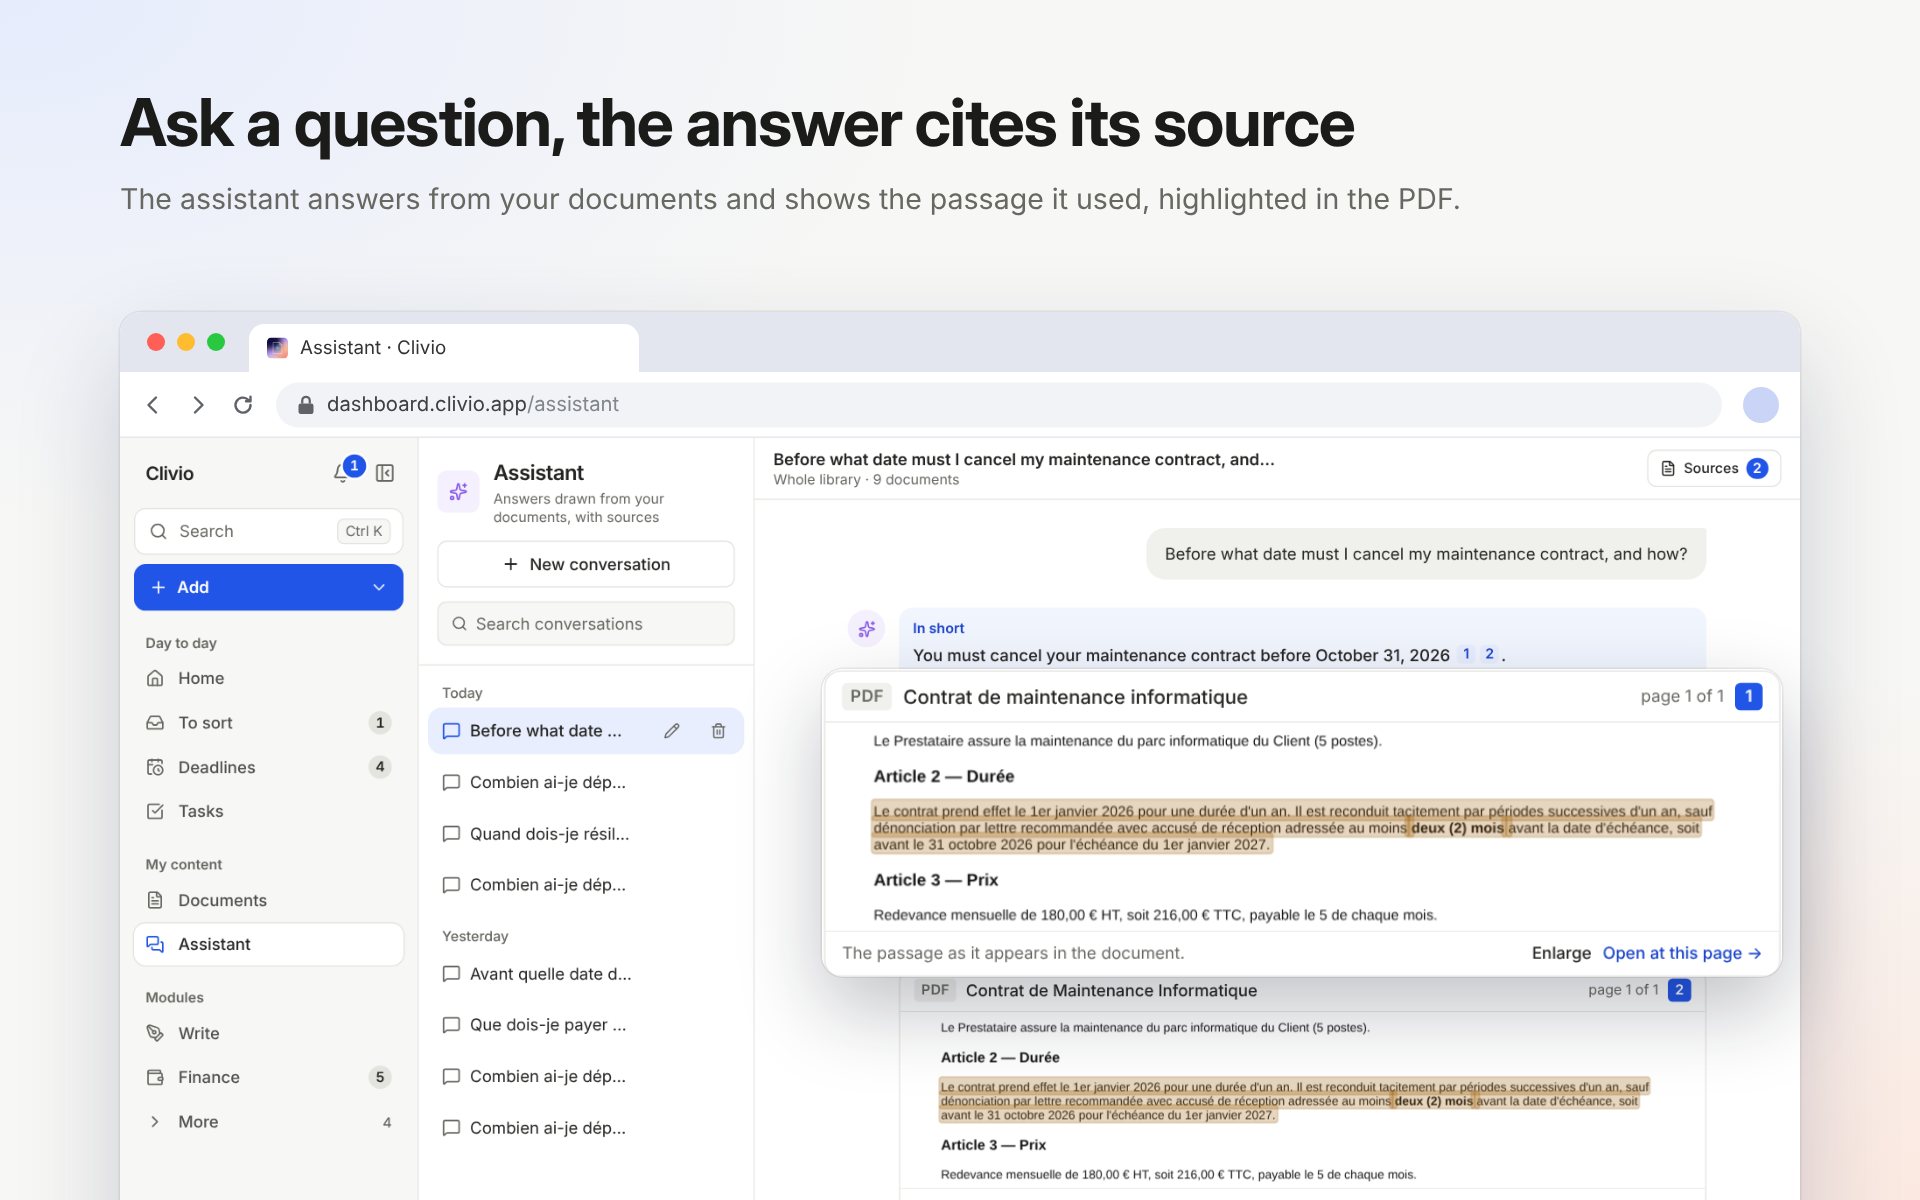
Clivio is a document vault that does the filing for you. Forward an email, upload a file or snap a receipt, and it reads the document, renames it, tags it and puts it away. Invoices end up as numbers on a dashboard. And when you ask a question, the answer comes from your own documents, with the passage it used.

Clivio’s assistant answering when to cancel a maintenance contract, with the passage it used highlighted in the PDF
Assistant. Every answer links back to its source.
Clivio’s command bar searching for an invoice, with its amounts, due date and summary previewed
Command bar. Search, act or ask from anywhere.

Hermes

My email assistant.

Hermes Agent by Nous Research, connected to Clivio over MCP.

Hermes answers my email. It has its own address, reads everything that comes in, replies to what it can and hands me the rest.

It runs on Hermes Agent, the open-source agent from Nous Research, and it’s connected to my Clivio vault over MCP. That means it can look through my documents, open one to answer a question, or file an attachment someone sent me in the right place.

Two example exchanges. Names and details are made up.

From
Hermes <hermes.ai@felix-boittin.fr>
To
Camille R.
Subject
Re: Contentsquare training for our team

Hello Camille,

Thanks for your message. Félix led the global Contentsquare training programme at Louis Vuitton, so this is very much his kind of project.

I’ve passed your request to him with a short summary, and he’ll get back to you himself. In the meantime, his CV is attached.

Hermes, for Félix Boittin

Attached: BOITTIN_CV_EN.pdf, fetched from Clivio.

Handled by Hermes

Questions about my work. Requests for my CV. Files people send me, which go straight into Clivio.

Passed to me

New projects, anything personal, and anything Hermes isn’t sure about. Always with a summary.

Prisme

Personal project, October 2026.

Python, DuckDB, dbt, Observable Framework.

The Prisme film, 33 seconds, made in code. Map outlines: IGN.

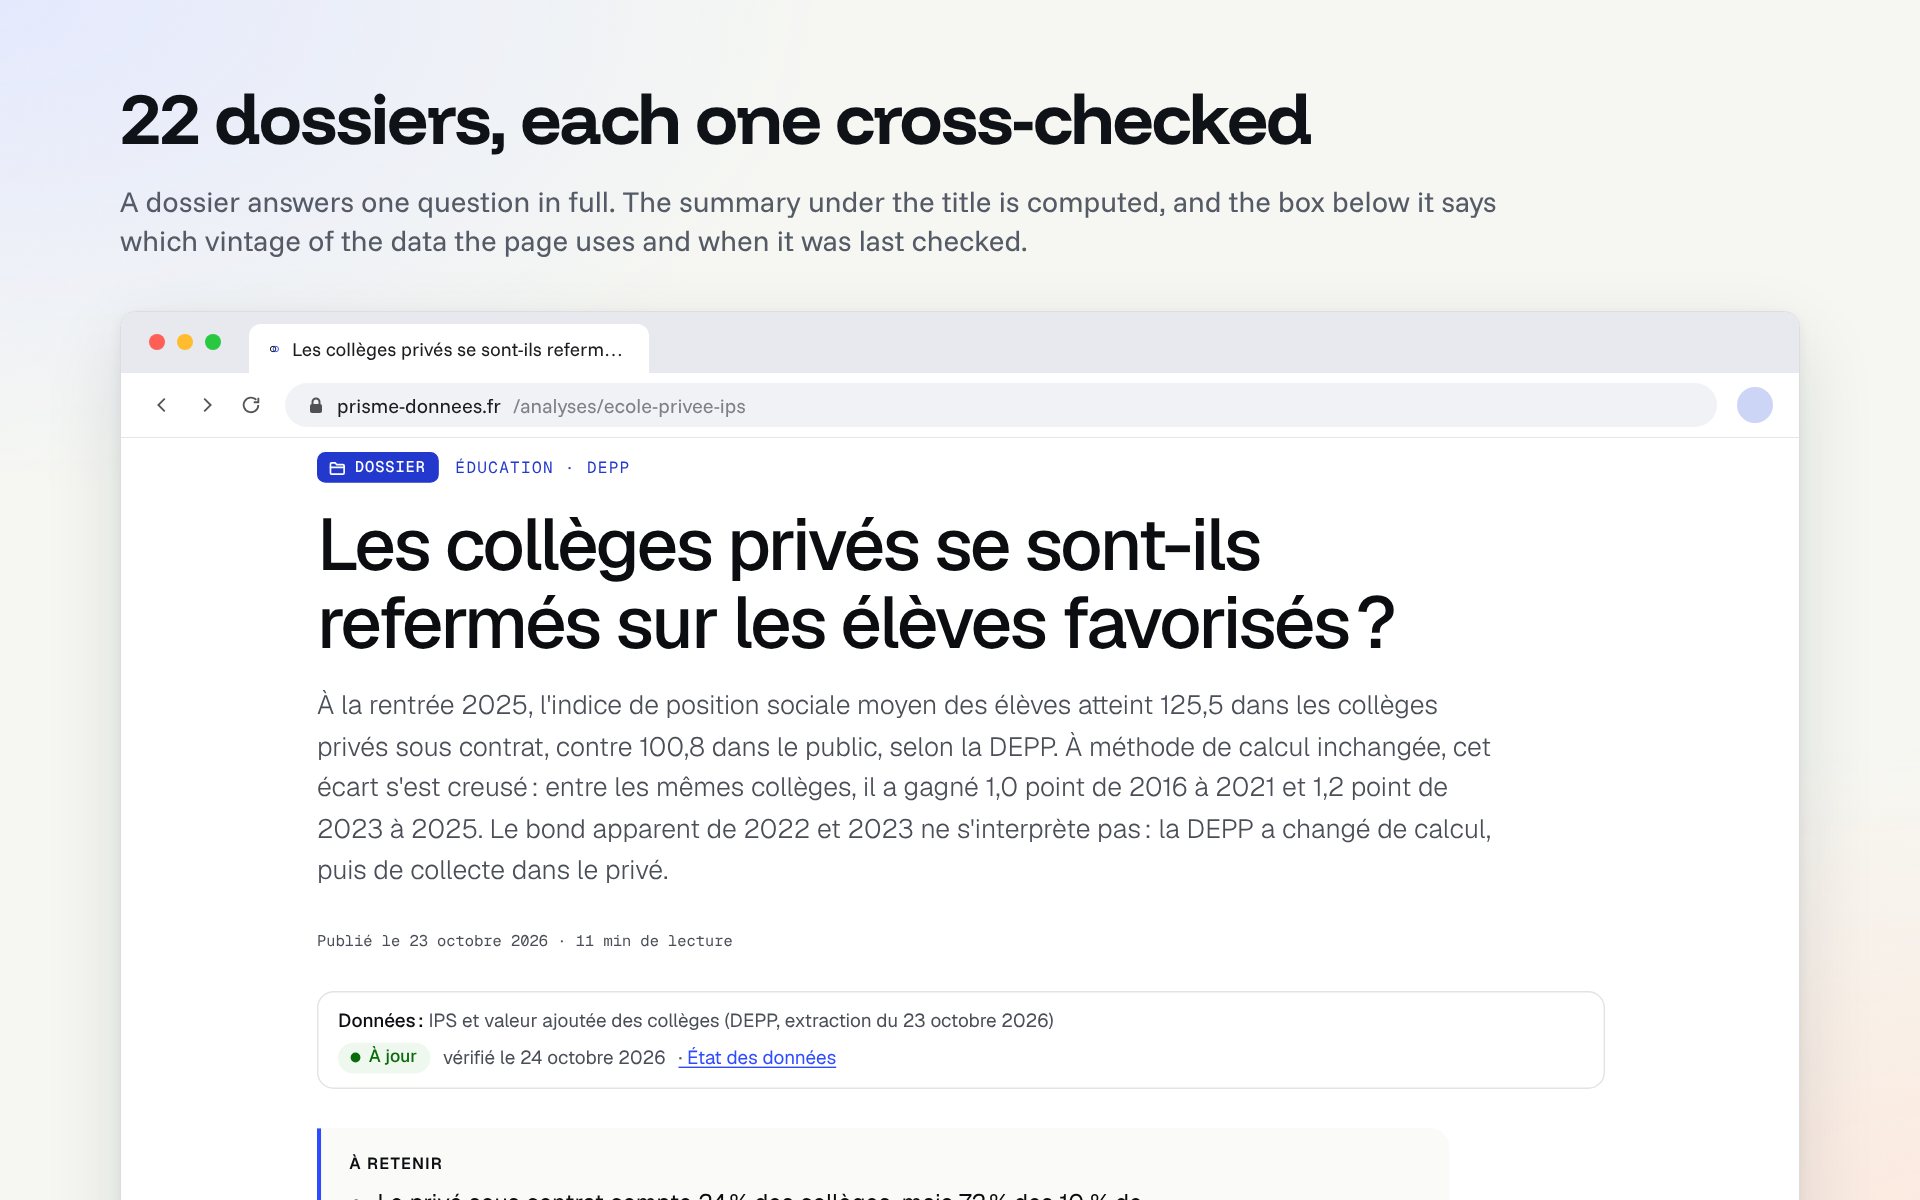
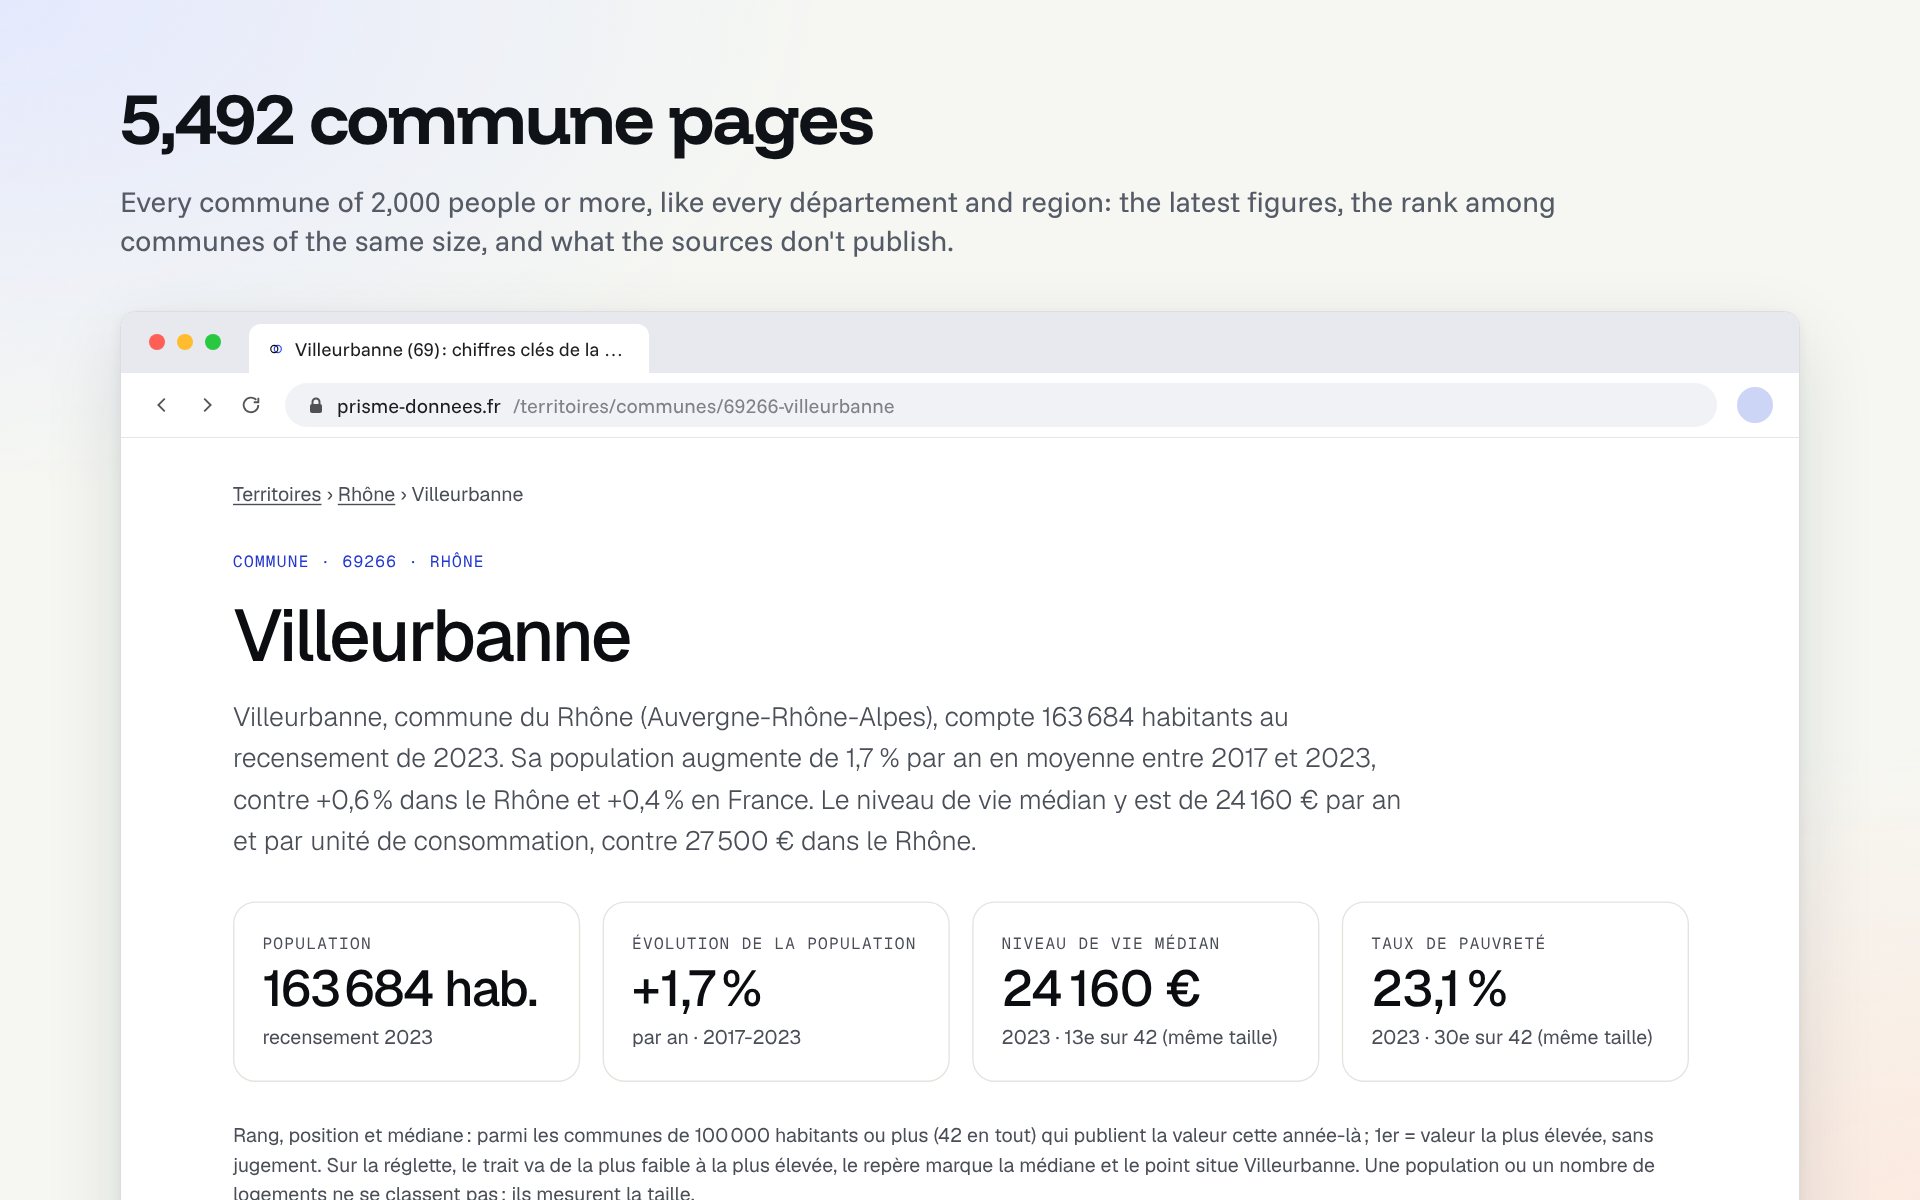
Prisme joins up French and European public data, from Insee and Eurostat to Météo-France and the Ministry of the Interior, in a single geography. It has 22 dossiers, fact checks, a page for every commune of 2,000 people or more, a section on public spending and an open data cube. Every figure is computed, every claim is checked against the data, and each dossier is cross-checked with the figures its producers publish.

A Prisme dossier on private and public schools, with its title, its computed summary and the date its data were last checked
Dossiers. Every number in the text is computed at build time.
The Prisme page for Villeurbanne, with its population, growth, median living standard and poverty rate
Place pages. 5,847 of them, from communes to EU regions.

About

I started out as a freelance web developer in Bordeaux, building sites meant to convert and wiring up their analytics. Then I ran digital and web analytics at Photonis, in the defence sector, before joining Converteo in Paris in 2022, where I’m now a senior consultant.

I studied information and communication at Rennes 2, then digital marketing and data analytics at OMNES Education. My days go into measuring how people use websites. A good part of my evenings goes into building them.

Education
MSc Digital Marketing & Data Analytics, OMNES Education, 2022
BA Information & Communication, Université Rennes 2, 2020
Certifications
Google Analytics, Google Ads Search & Measurement, AT Internet
Languages
French, English, some Spanish