Prisme
- Role
- Personal project: design, data pipeline and analyses
- When
- October 2026
- Status
- Live at prisme-donnees.fr
- Stack
- Python, DuckDB, dbt, Observable Framework, GitHub Actions, Vercel
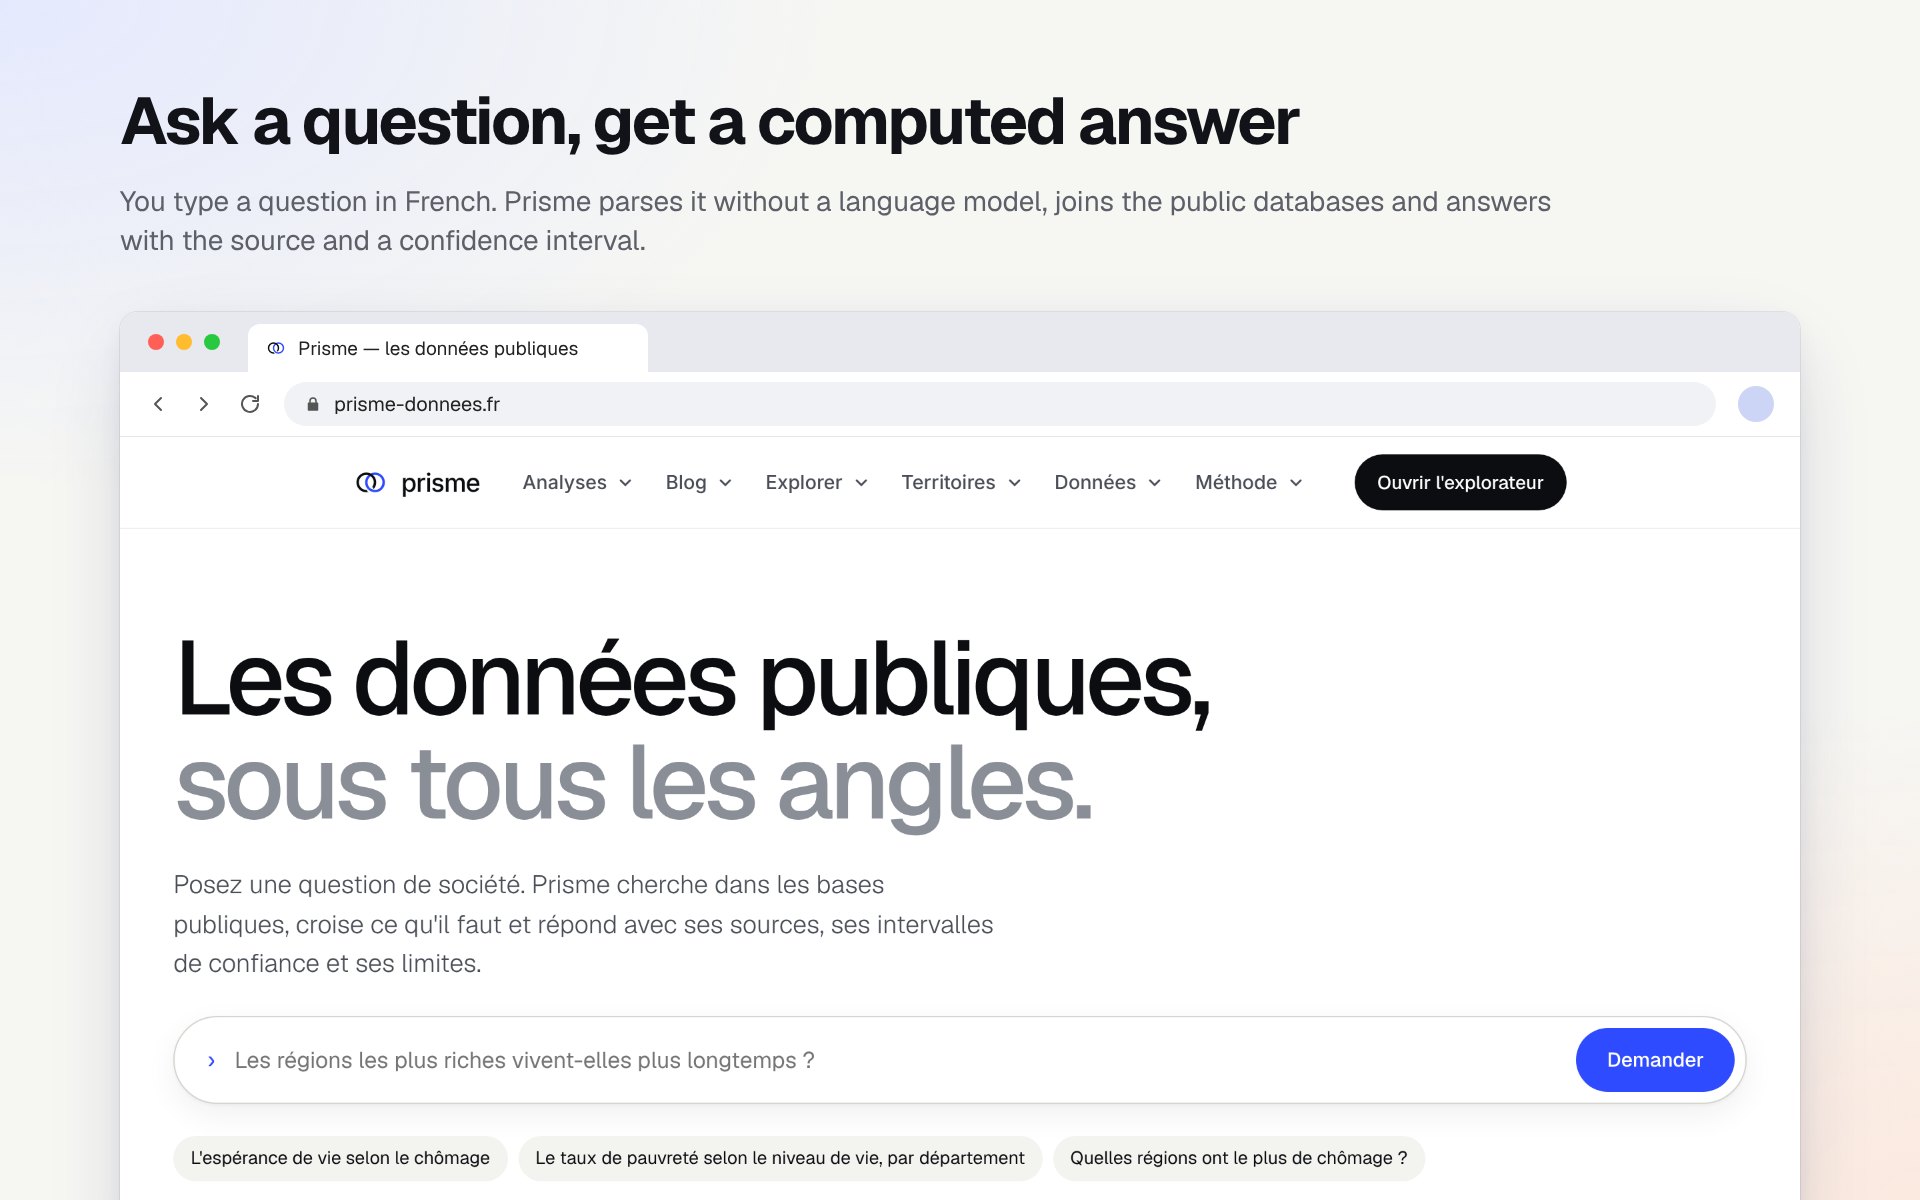
Prisme takes the big public databases, from Insee, Eurostat, the French tax administration and the World Bank, puts them into a single geography, and checks every figure before it reaches a page.
This overview is the first of two parts. The second is about how it’s built: the warehouse, the rules the data follow, and the statistics.
The problem
Public data in France is open, but it doesn’t fit together.
Every year communes merge or split, so a code from 2015 may no longer exist. Eurostat redraws its regions every few years. A value hidden for confidentiality looks just like a zero, and a median can’t be added up the way a population can. None of this raises an error: a wrong join just gives you a wrong number. Analysing data is my job, and I wanted one place where those joins are done properly, once, and where every sentence says only what the calculation shows.
What’s on the site
- Analyses
- Many in-depth studies, from excess mortality in Europe to the price of 50 m² in each département
- Guides
- 12 blog posts on reading public data: DVF, Filosofi, the census, Eurostat, licences, maps
- Places
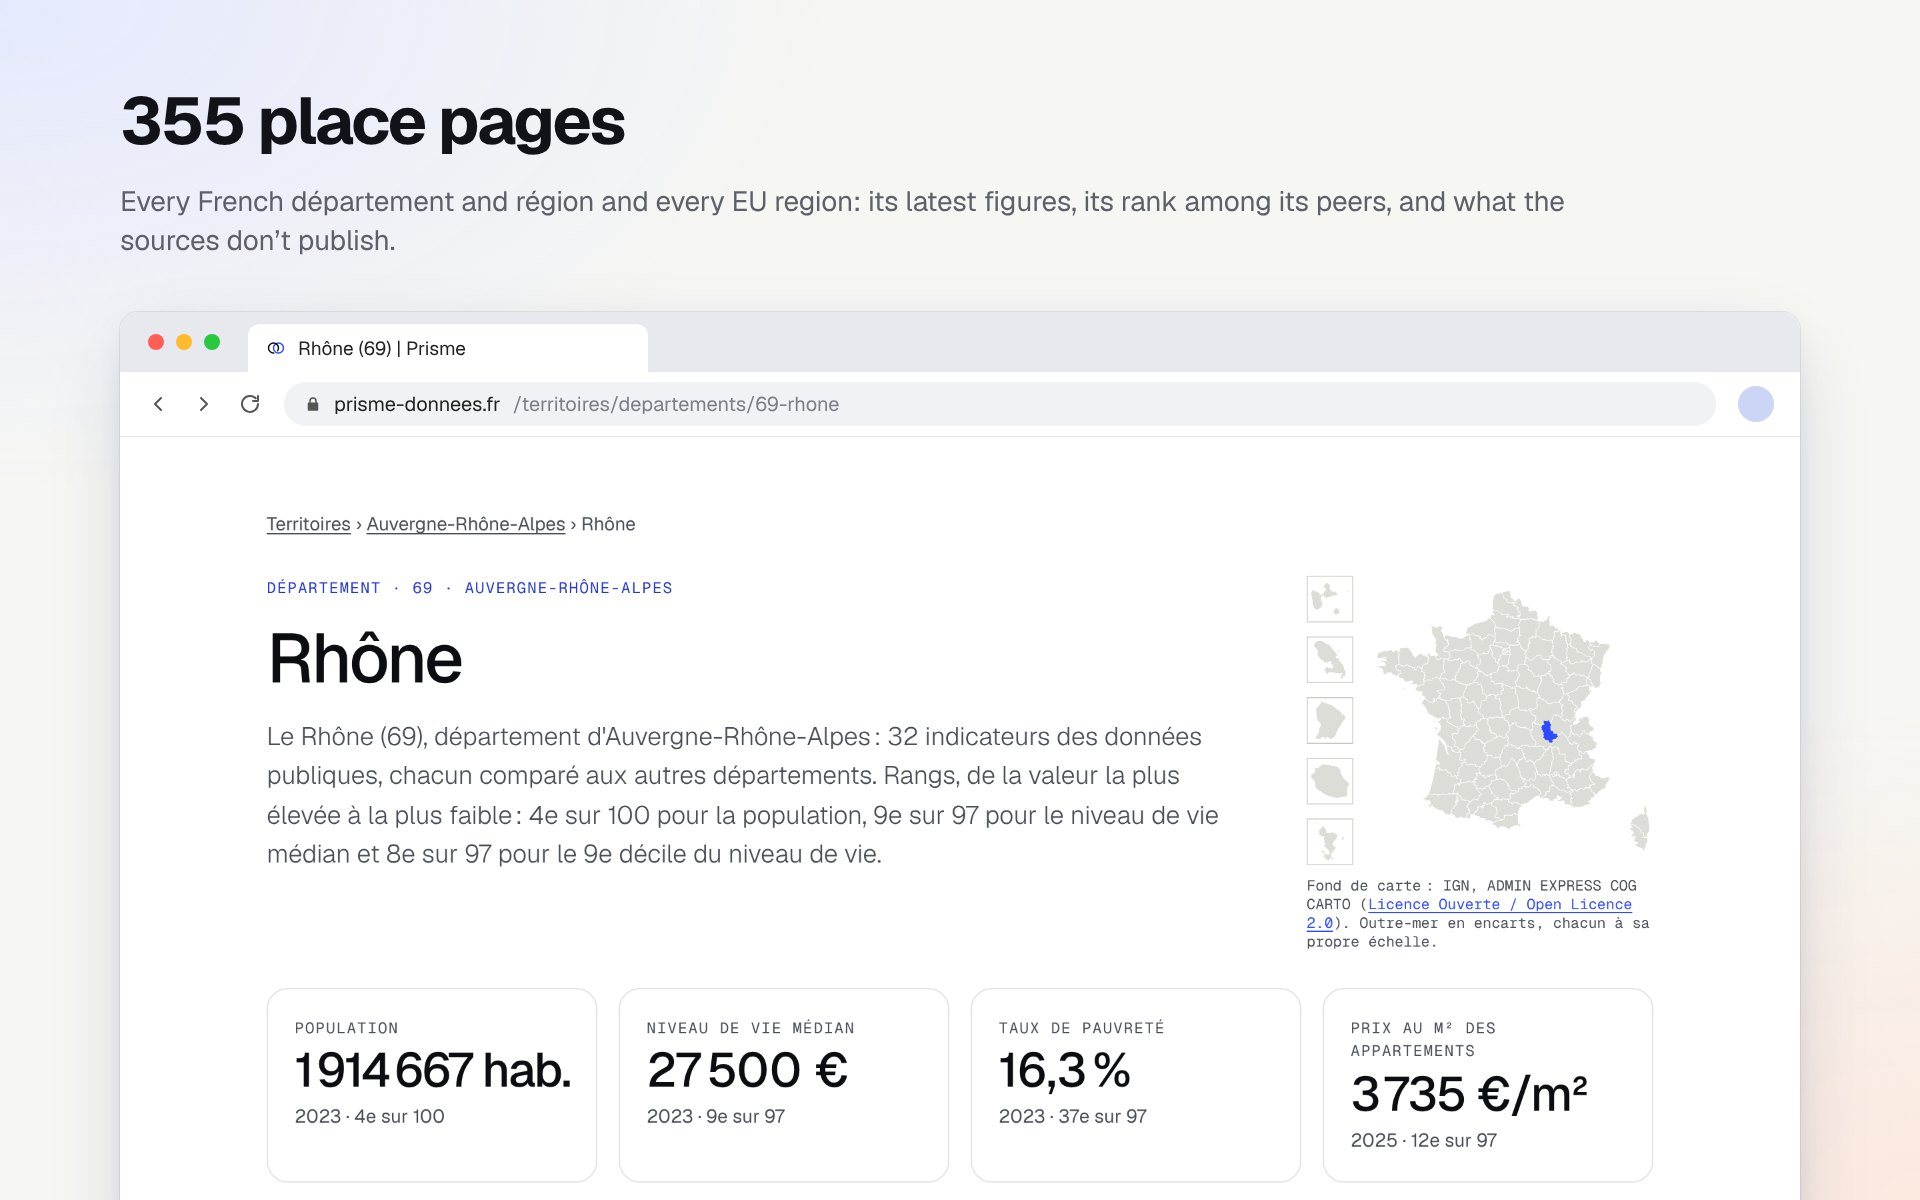
- 355 pages: 101 départements, 18 French regions and 236 EU regions
- Indicators
- 47 ranked indicator pages, each with its map, definition and source
- Data
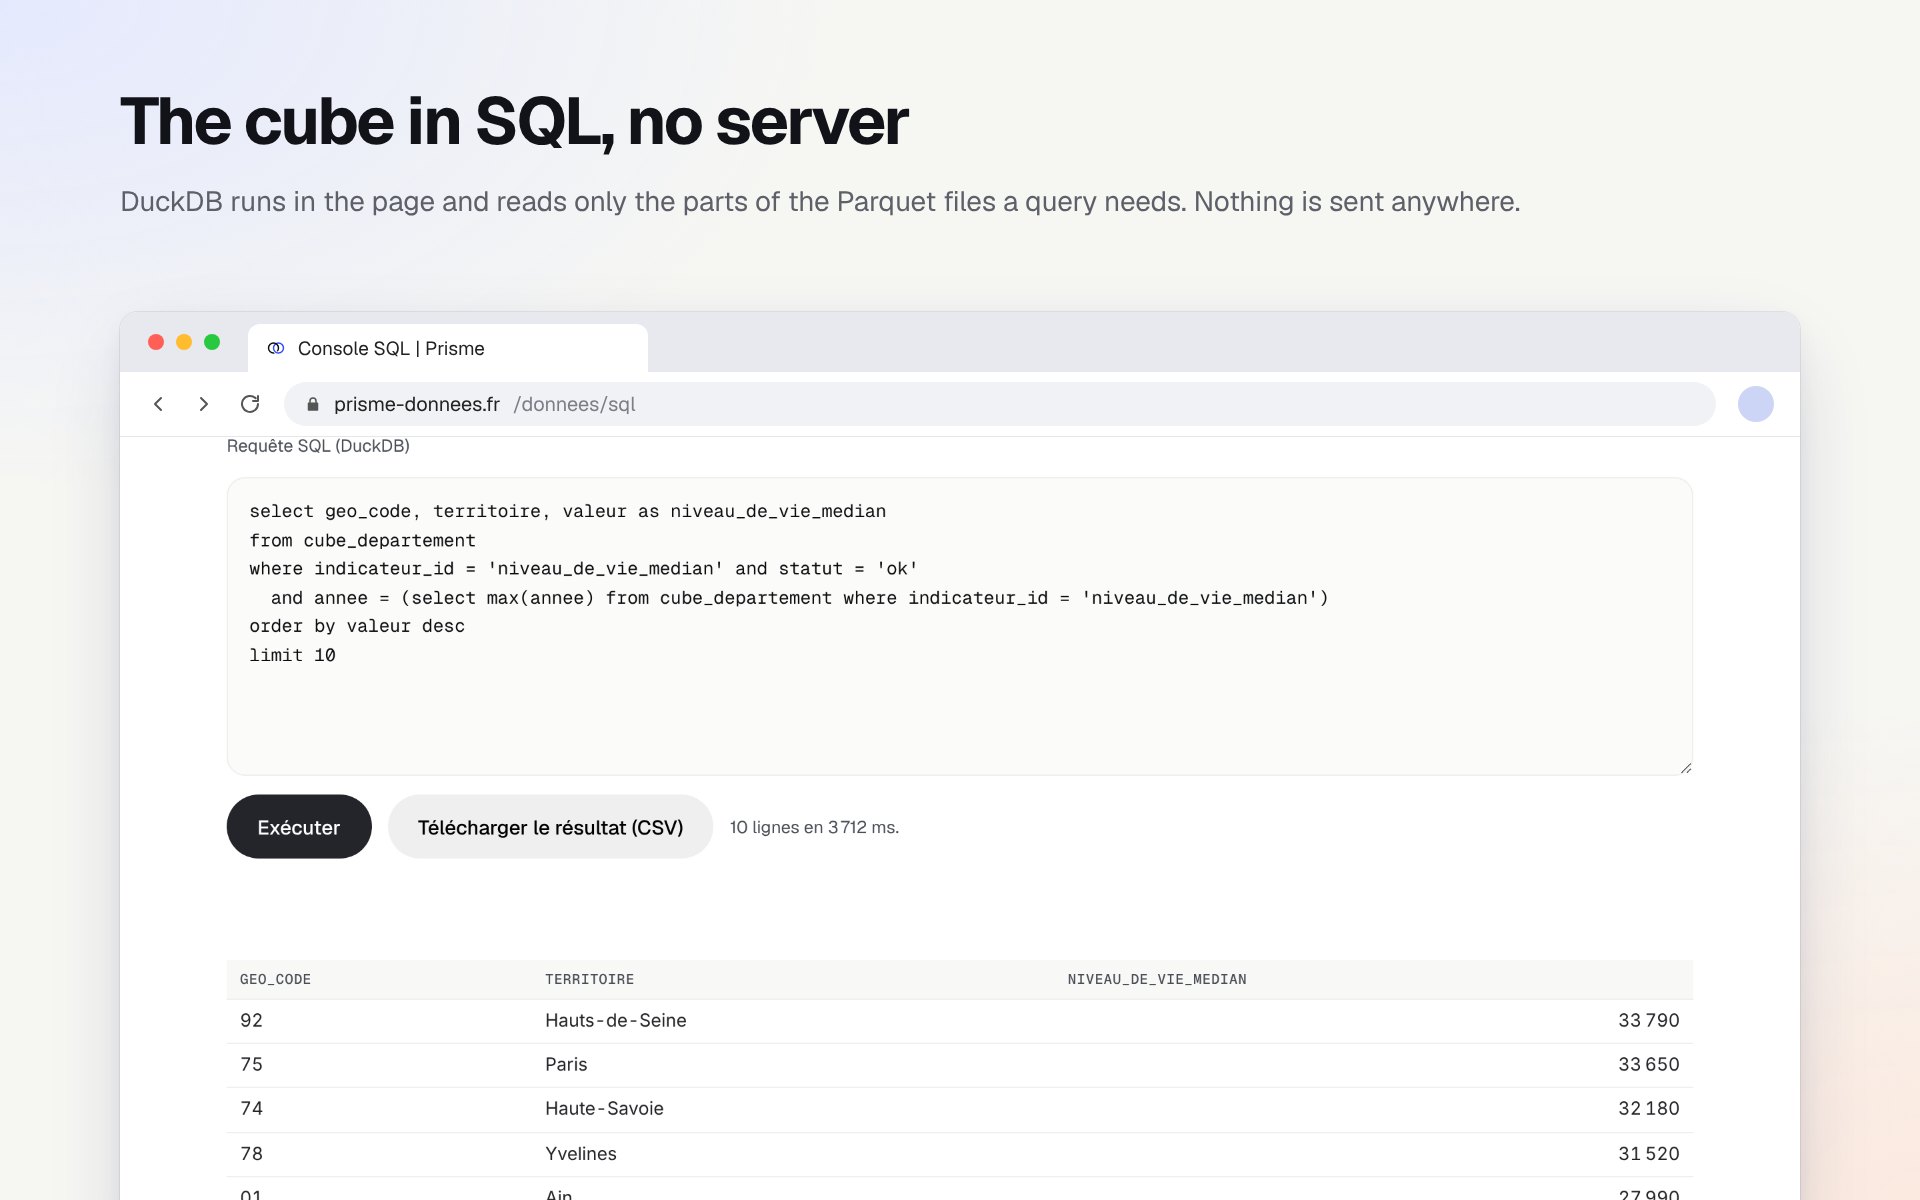
- A cube of 2.7 million rows, 1960 to 2025, to download as Parquet or CSV, or to query in SQL
Counted on the live site on 21 October 2026.
Analyses that check themselves
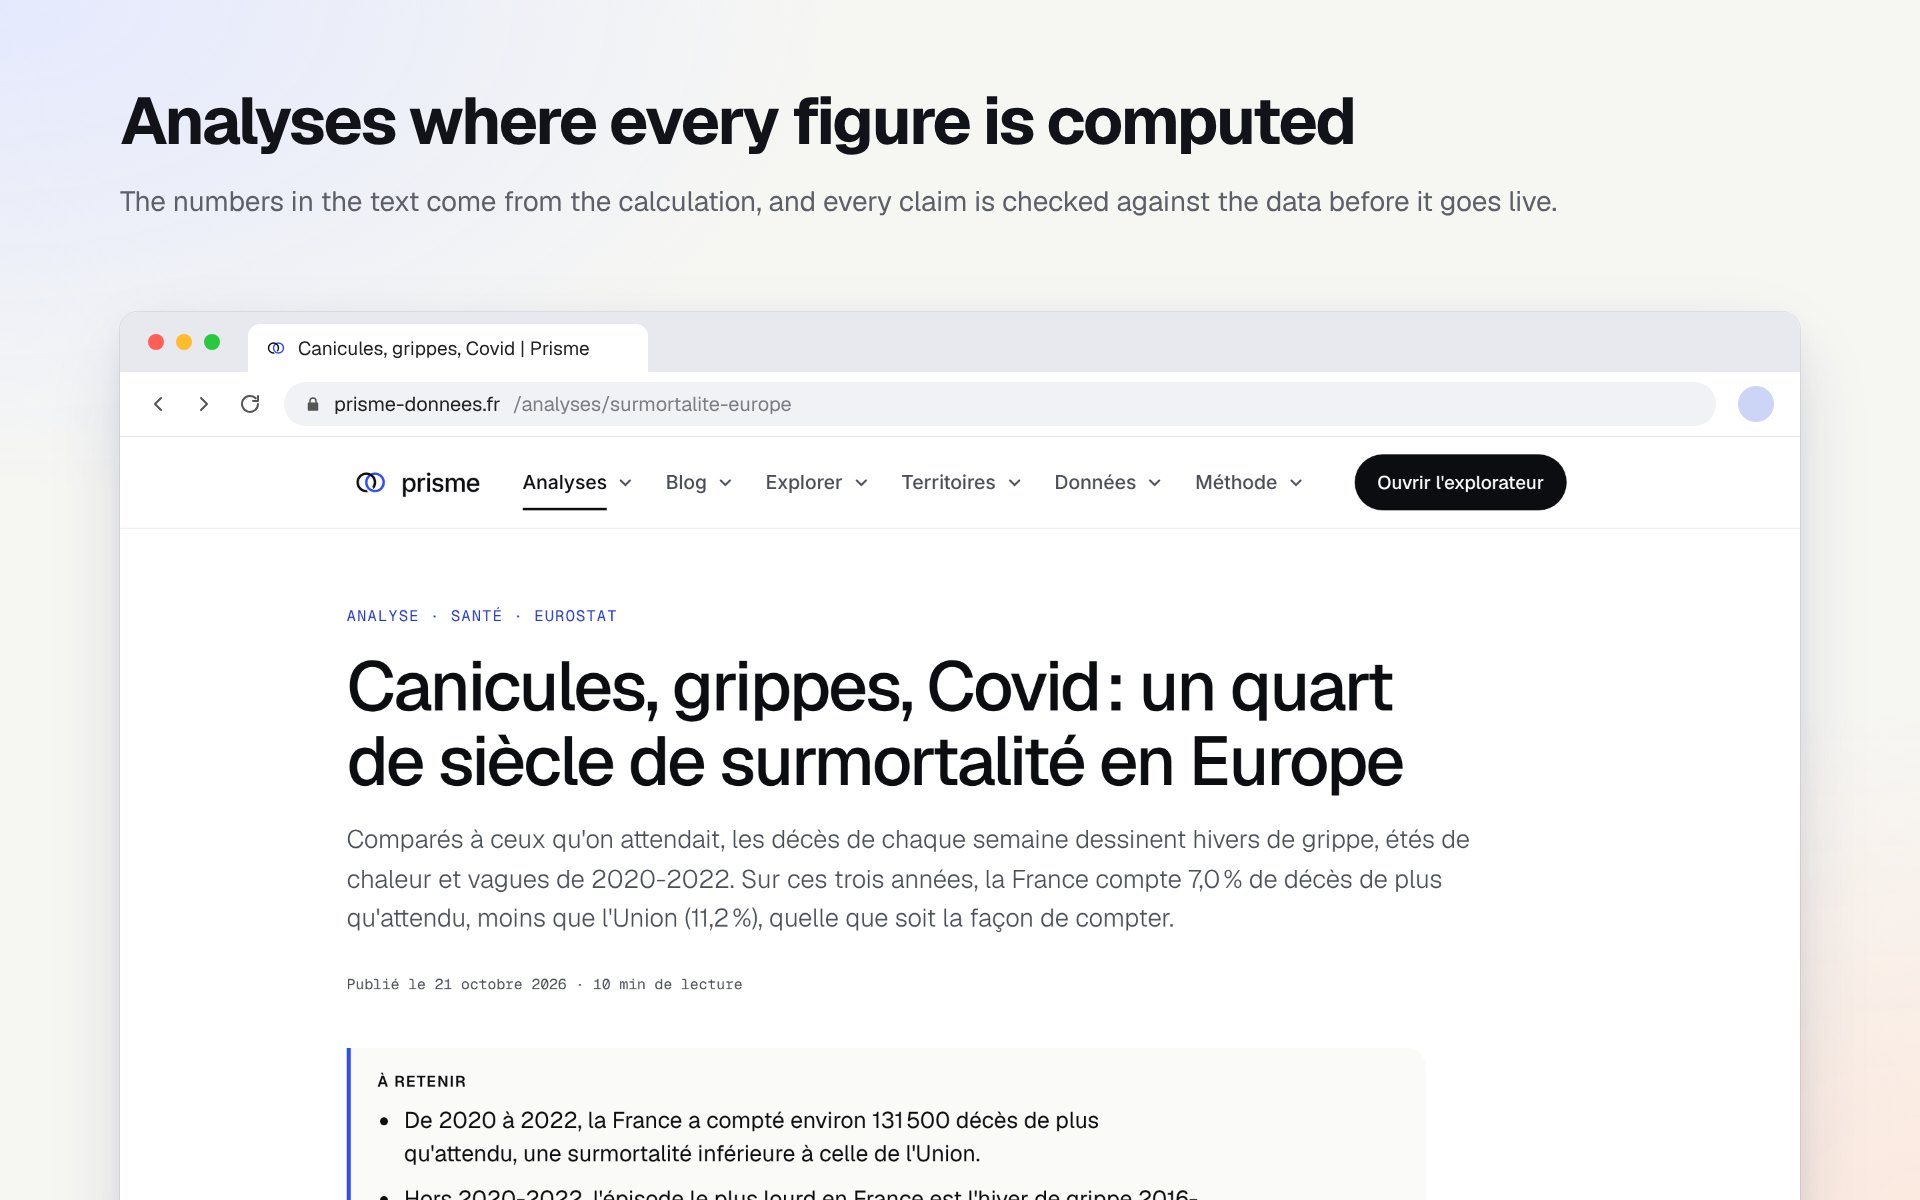
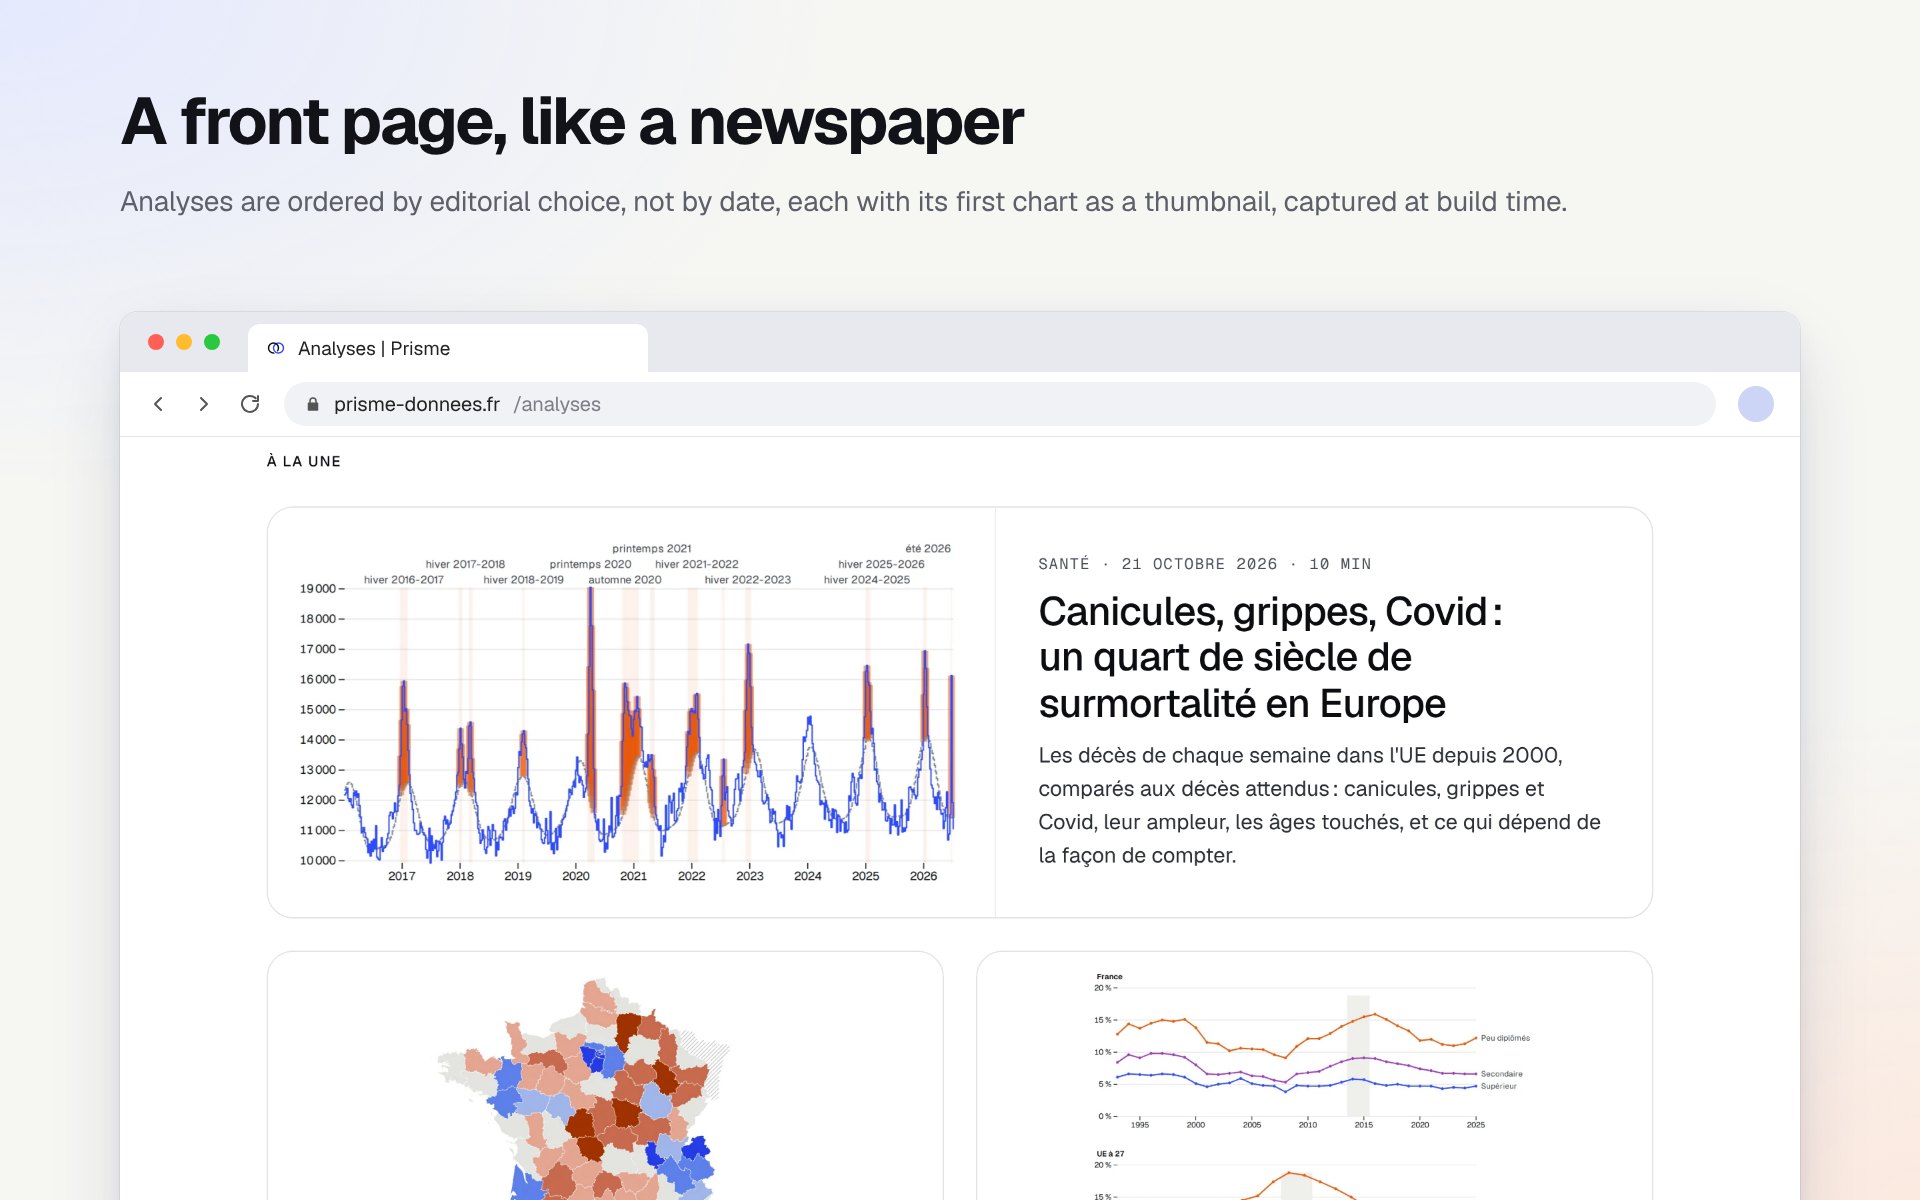
Each analysis computes its figures from the warehouse and writes the sentences around them. A sentence is a claim: if the data stop supporting it, the build fails and the page doesn’t ship.
Excess mortality in Europe
Weekly deaths in the EU since 2000 against expected deaths: heatwaves, flu and Covid, how big each was, the ages hit, and what depends on how you count.
France’s fault lines
Read all at once, the indicators of the départements draw a few fault lines: degrees and prices against an older, working-class France, then poverty, on its own. No clean blocks.
Does a degree still pay?
Unemployment, income and pay by level of education, in France and the EU: a gap that widens in points during crises, and a premium that is wearing thin, smaller for women.
Medical deserts
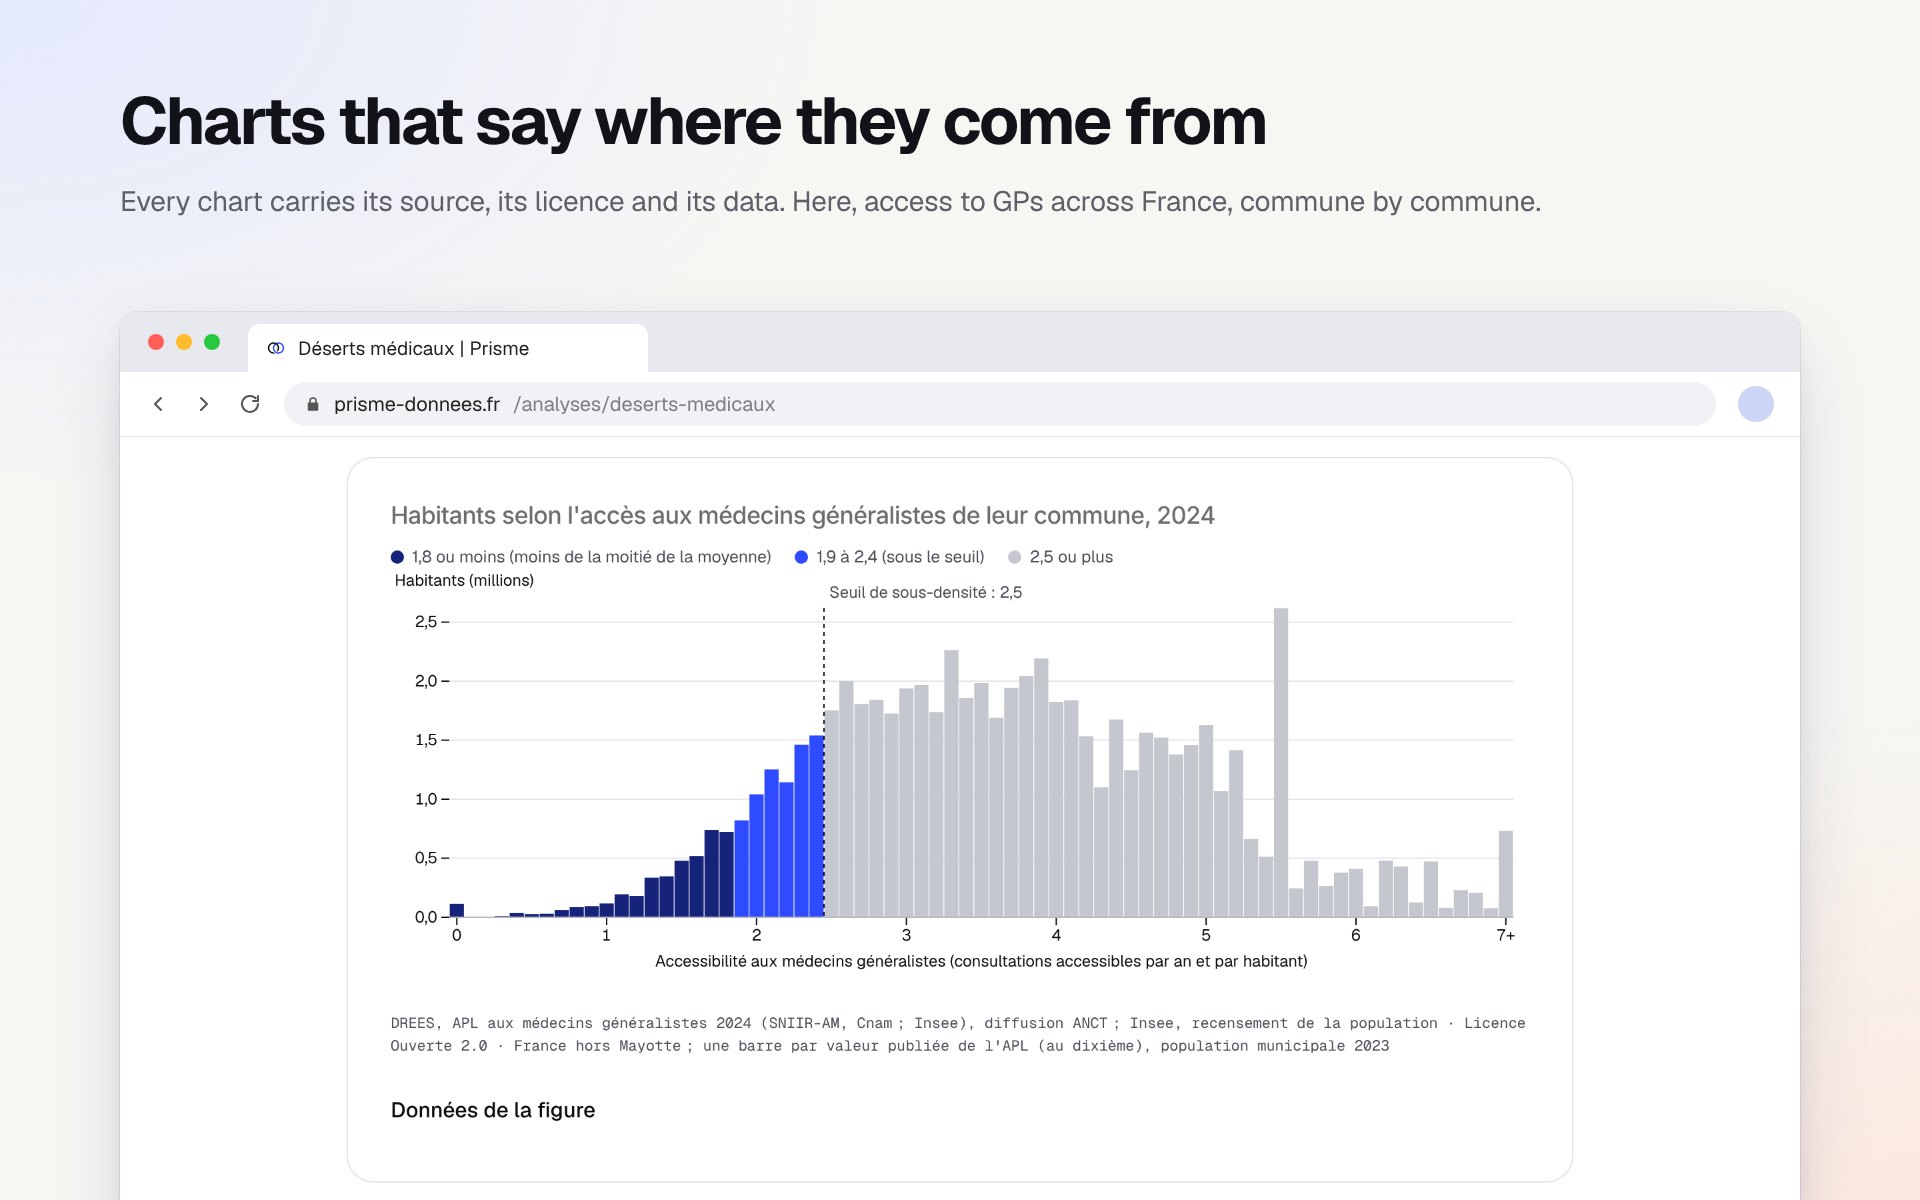
Where access to a GP falls below the shortage threshold, how many people that is, and why dense suburbs are as short of GPs as the countryside.
Are EU regions converging?
Since 2000 poorer regions have caught up with richer ones, but only from one country to the next: within most countries the richest region, often the capital, pulls further ahead.
A Simpson’s paradox
Across EU regions, more unemployment goes with longer lives. Within each country, it’s the other way round. Measured on Eurostat data.
Tools for your own questions
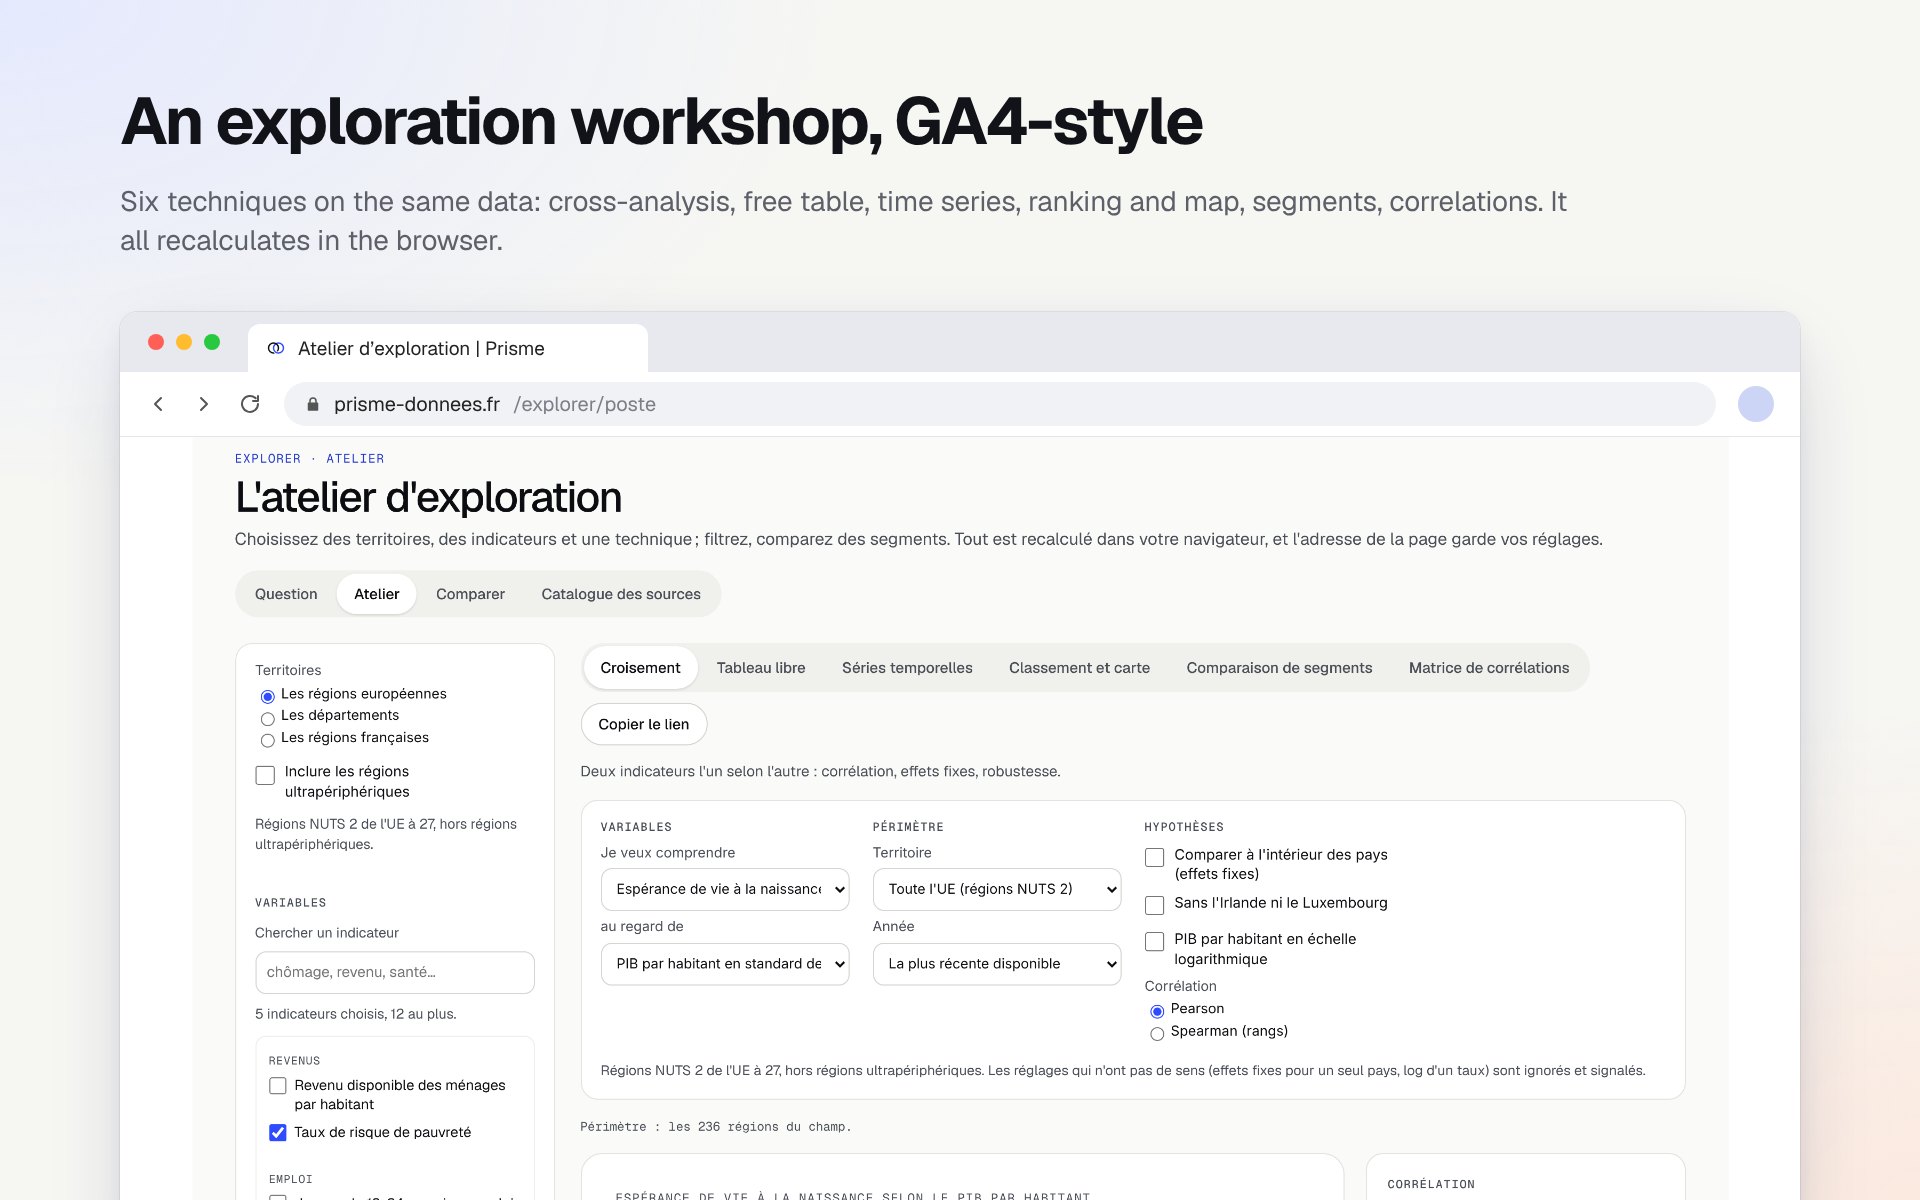
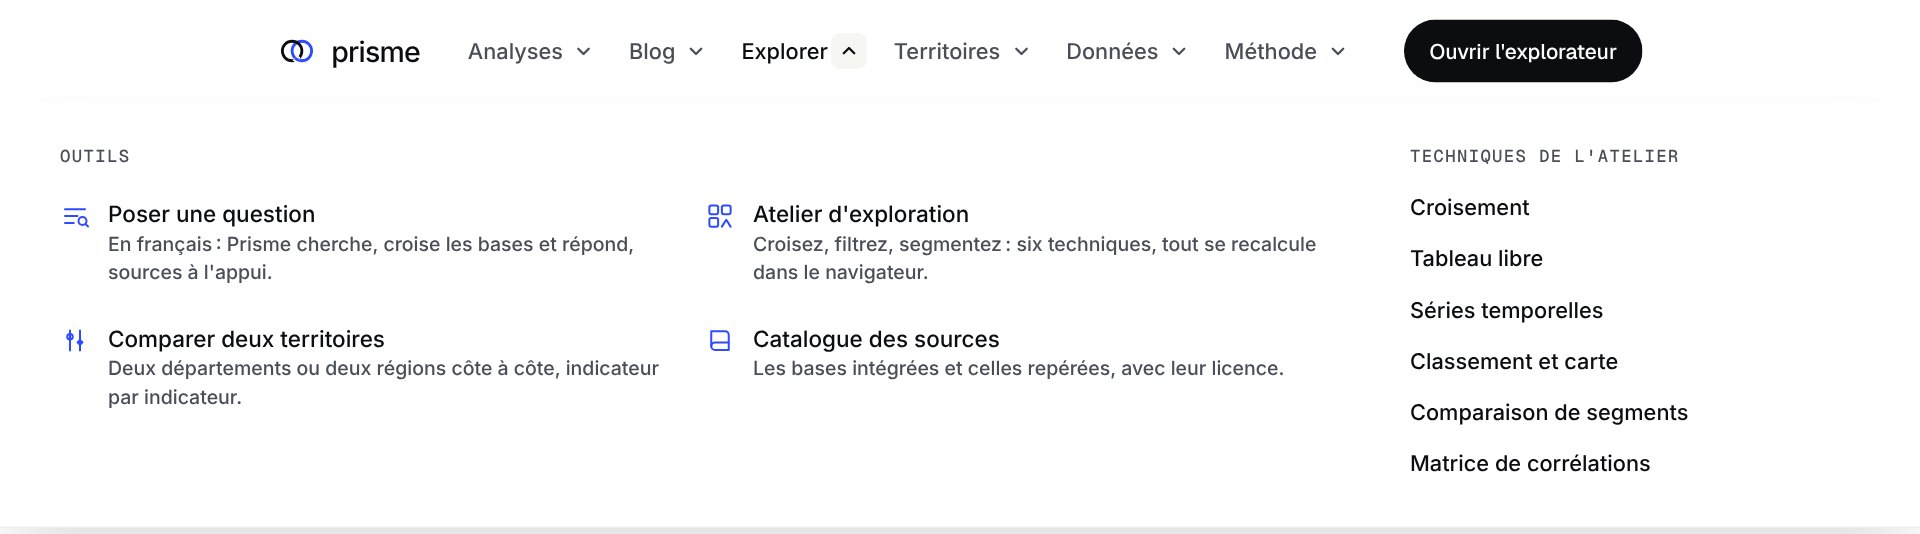
The analyses answer my questions. The tools are there for yours.
Ask a question
Questions are understood without a language model, from a dictionary built from the indicator register. Answers are templates filled in by the calculation: nothing to pay per question, and nothing made up.
Compare two places
Two départements, two French regions or two EU regions side by side: the same indicators, the same year, their rank and the gap.
Rankings and maps
A page per indicator, with every territory from top to bottom, its map, its definition and its source.
The open cube
One file per geographic level, Parquet and CSV, with a dictionary that gives each indicator’s unit, source and licence. A missing value always says why it’s missing.
Made to be read
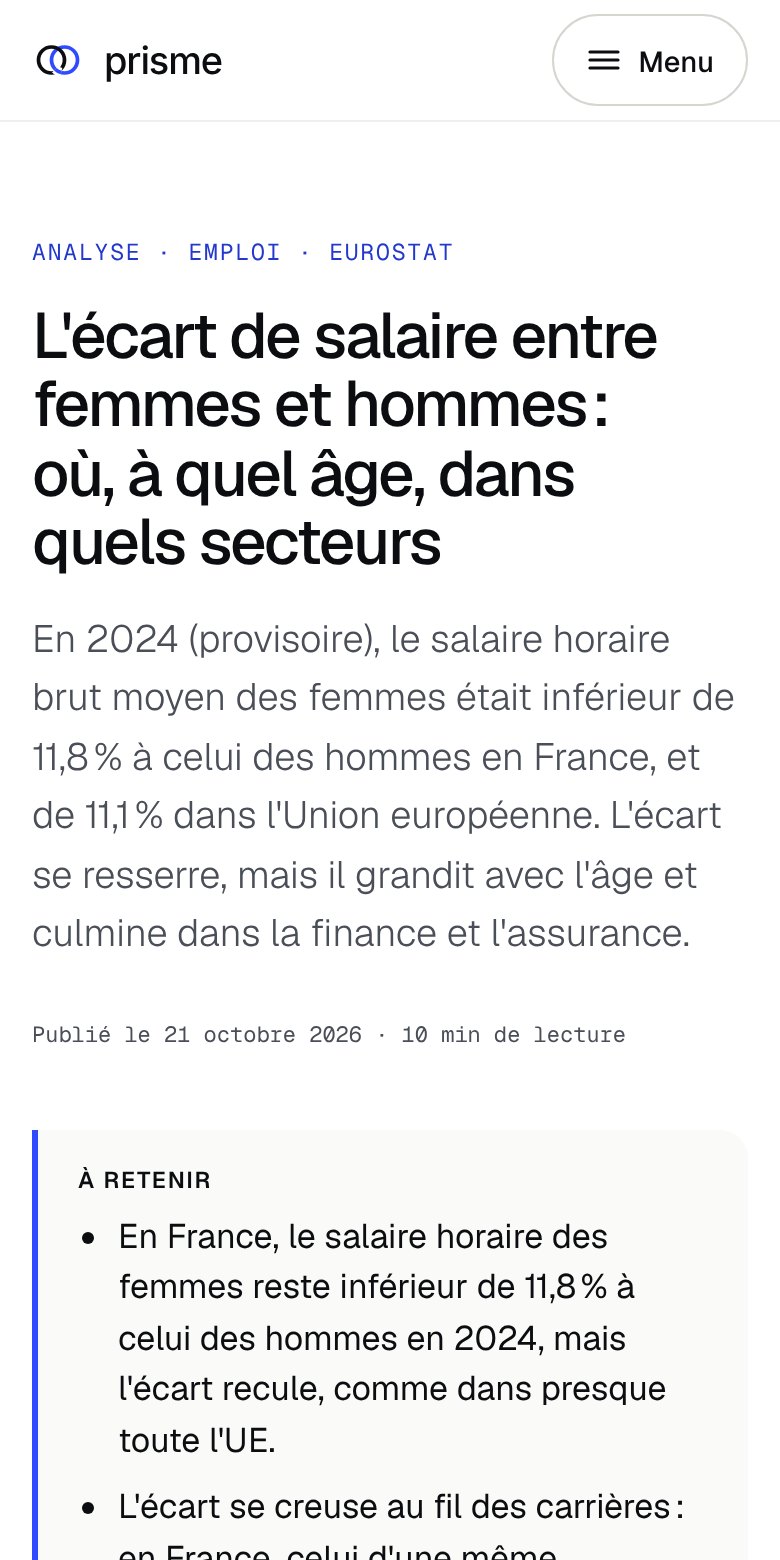
A reference site has to be easy to read. Every analysis opens with its key points, the chart comes early, and the method sits at the end.
What’s next
New analyses are on hold for now.
Next on the list are climate, public spending by function, inflation and causes of death, each of which needs a new source, and a page that brings the main findings together.